


Binding Free Energy Analysis Services
Service Features
Our binding free energy analysis service leverages high-precision algorithms and automated workflows to deliver binding affinity predictions that correlate strongly with experimental data, effectively reducing the cost of trial-and-error in wet-lab experiments. Through the integration of multiple methods and visualized energy decomposition, we provide in-depth mechanistic insights into molecular interactions, offering reliable support from hit identification to lead optimization. Our expert team collaborates closely with you throughout the process, ensuring that computational results effectively inform your R&D decisions.
Service Introduction
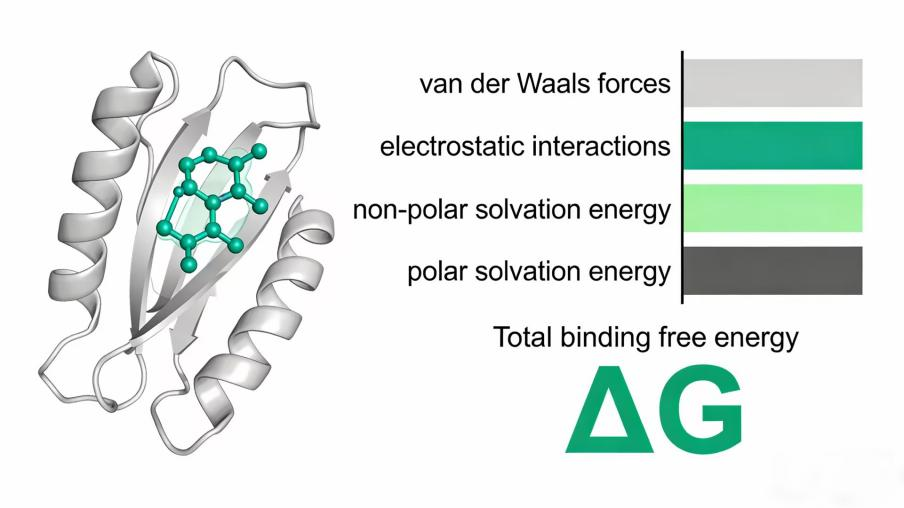
Based on MD trajectories, we quantitatively calculate ligand-receptor binding affinities and decompose the energy contributions to elucidate the binding mechanism.
Service Advantages
- Energy Quantification: MM/PBSA, Alanine Scanning
- Energy Decomposition: van der Waals, electrostatic, solvation, and entropy contributions
- Hotspot Residue Identification: guiding mutagenesis experiments
Service Process
Customer Requirements
Complex Structure
MD Trajectory (can be provided separately or generated by us)
List of Residues of Interest (optional)
Service Description
| Service Name |
Service Description |
Deliverables & Specifications |
Turnaround (Business Days) |
| Binding Free Energy Analysis |
Energy calculations based on MD trajectories (MM/PBSA), energy component decomposition, alanine scanning, and interaction fingerprint analysis. |
Deliverables: | 1-2 |
| • Total binding free energy data table | |||
| • Binding energy bar chart | |||
|
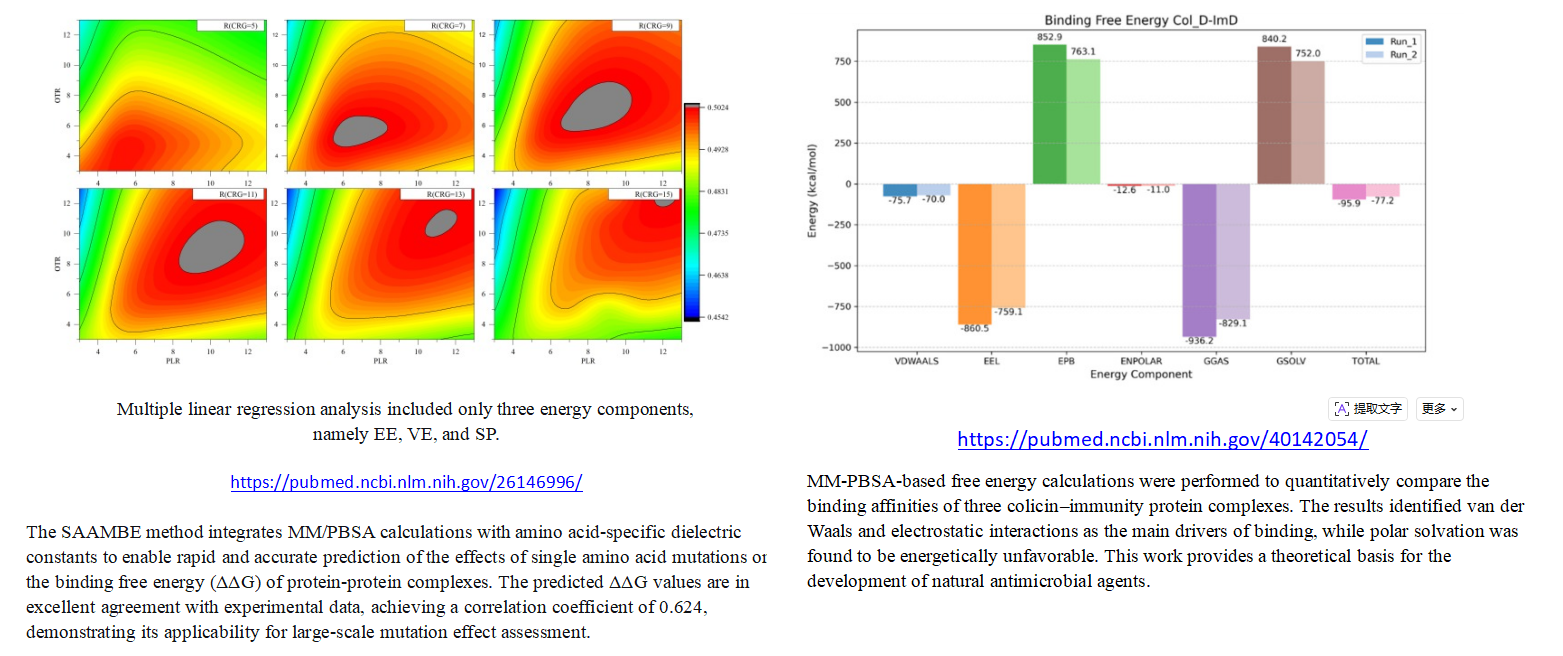
• Pie chart or stacked bar chart of energy contributions (van der Waals, electrostatic, non-polar solvation, polar solvation, entropy, etc.) |
|||
| • Detailed energy component values in Excel format | |||
| • ΔΔG data table (alanine scanning) | |||
| • Hotspot residue heatmap | |||
| • 3D structure with "hotspot" residues labeled | |||
| • Interaction fingerprint matrix or heatmap | |||
| • Ligand-residue interaction pair list with occurrence frequencies | |||
| Specifications: | |||
| • Relative binding energy trend analysis provided | |||
| • Suitable for compound ranking and mechanistic interpretation | |||
| • Quantitative assessment of key residue contributions |
Case Studies
Ready to Start Your Project?
Our expert team is ready to support your computational biology research. Get in touch with us for a consultation or request a quote today.
Contact Our ExpertsQ&A
Are MM/PBSA results reliable?